LogTag Analyzer software
Software for configuration, data download, and evaluation of LogTag data loggers
LogTag Analyzer is a free application recommended for users of LogTag data loggers. It serves as a clear and practical tool for device setup, downloading recorded data, and its subsequent display and evaluation.
The software is designed to simplify everyday work with LogTag temperature and humidity data loggers. It enables quick access to stored data, archiving, and clear presentation in graph or table format.
Main features of LogTag Analyzer software
• automatic evaluation and storage of data from connected data loggers
• display and printing of recorded data in graph or table format
• support for multiple language versions
Language versions
LogTag Analyzer supports the following languages:
German, English, French, Italian, Spanish, Portuguese, Turkish, Simplified Chinese, Japanese, and Russian.
Clear data display in graph format
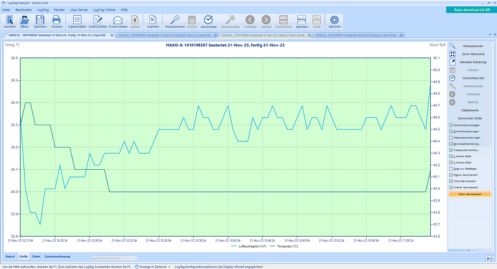
In the default setting, LogTag Analyzer displays downloaded or opened data in graph form. Thanks to color differentiation, it is possible to quickly evaluate whether the set limits were maintained during measurement.
• the red area indicates values above the upper alarm limit
• the blue area indicates values below the lower alarm limit
• the green area represents the acceptable range between the set limits
This type of display makes it easier to quickly check conditions during the storage and transport of sensitive goods.
Graph zoom function
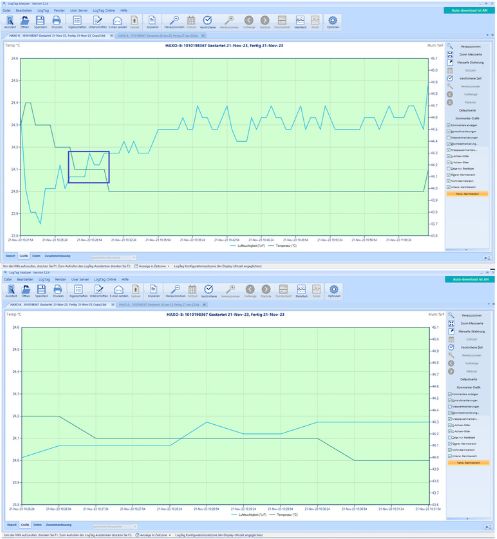
The software allows detailed work with the graph using the zoom function. The user can simply select a specific part of the graph with the mouse and focus on a particular measurement interval or event that requires closer inspection.
Clear report
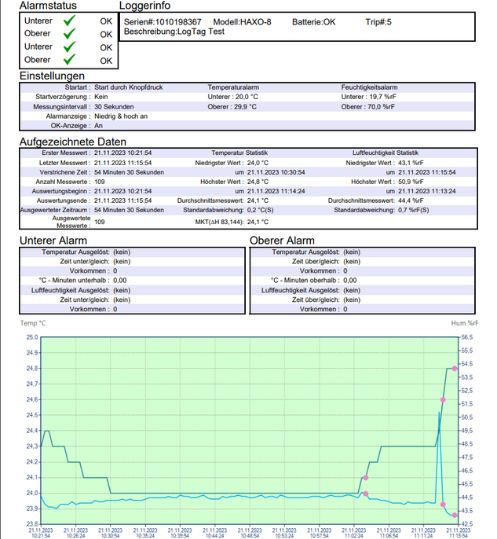
LogTag Analyzer displays measurement parameters and record information in clearly structured sections. The interface also includes a graph window, which is displayed below or next to the data depending on the application window size. This layout simplifies navigation in the data and makes checking, printing, and archiving easier.
Data logger configuration
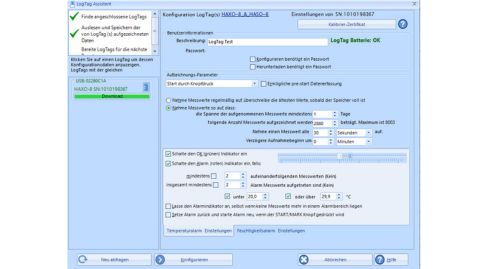
With LogTag Analyzer, data loggers can be easily configured before being put into operation. The software is used to set recording parameters and prepare devices for specific applications, for example for temperature and humidity monitoring during storage or transport.
Annotations in the graph
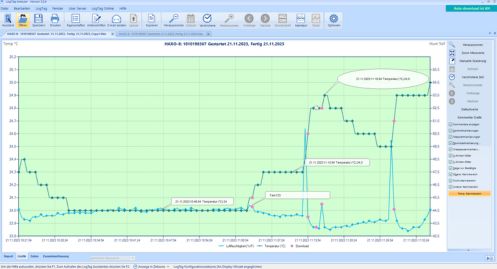
Notes and comments can be easily added to the graph. This function is useful for internal record evaluation, tracing specific situations, or adding explanatory information to the course of the measurement.
Comparison of multiple records in one graph
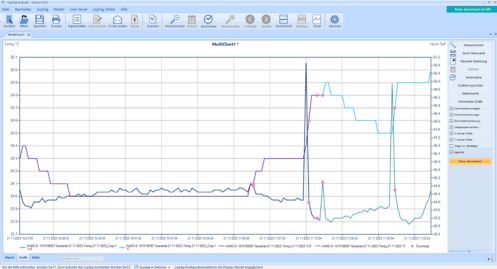
LogTag Analyzer allows multiple records to be displayed simultaneously in a single graph. This function is suitable for comparing data from multiple data loggers or, for example, for comparing temperature and humidity records between two devices. Multi-chart display is a practical tool for comparative analysis and checking measured conditions at different locations or over different time periods.
Who the software is suitable for
LogTag Analyzer is suitable for operations where it is important to monitor and document temperature or humidity, especially in areas such as:
• healthcare
• pharmaceuticals
• food industry
• logistics
• warehouses and cold storage operations
• laboratories
Recommended products5

Datalogger LogTag UTRIX-16
| Temperature range (max) | 70 °C |
|---|---|
| Temperature range (min) | -30 °C |

LogTag UHADO-16 Temperature and Humidity Data Logger
| Temperature range (max) | 70 °C |
|---|---|
| Temperature range (min) | -30 °C |
| Humidity measurement range | 0 to100% |


Datalogger LogTag UTRID-16R USB
| Temperature range (max) | 60 °C |
|---|---|
| Temperature range (min) | -30 °C |


Datalogger LogTag TRID30-7R
| Temperature range (max) | 60 °C |
|---|---|
| Temperature range (min) | -30 °C |


Datalogger teploty LogTag TRIX-16
| Temperature range (max) | 85 °C |
|---|---|
| Temperature range (min) | -40 °C |
LogTag Analyzer is a practical software solution for anyone working with LogTag data loggers who needs a reliable tool for device configuration, data download, and evaluation. It offers clear graph and table displays, easy report handling, the ability to compare multiple records, and features that simplify both record-keeping and measurement control in everyday operation.